Where America’s Population Growth Is Overlapping With Higher Wildfire Risk
Key findings
- Among U.S. counties with at least 20,000 residents, the 100 fastest-growing from 2024 to 2025 had a median USDA Risk to Homes ranking at the 66th national percentile, compared with the 44th percentile across all counties included in the analysis.
- 45% of the 100 fastest-growing counties ranked in the top 30% nationally for Risk to Homes. Across the full comparison group, the figure was 26.8%.
- 19 of the 100 counties adding the most residents ranked in the top 10% nationally for Risk to Homes, compared with about 9% of counties overall.
- Texas had 26 counties among the national top 100 for percentage population growth. All 26 ranked above the national midpoint for USDA Risk to Homes.
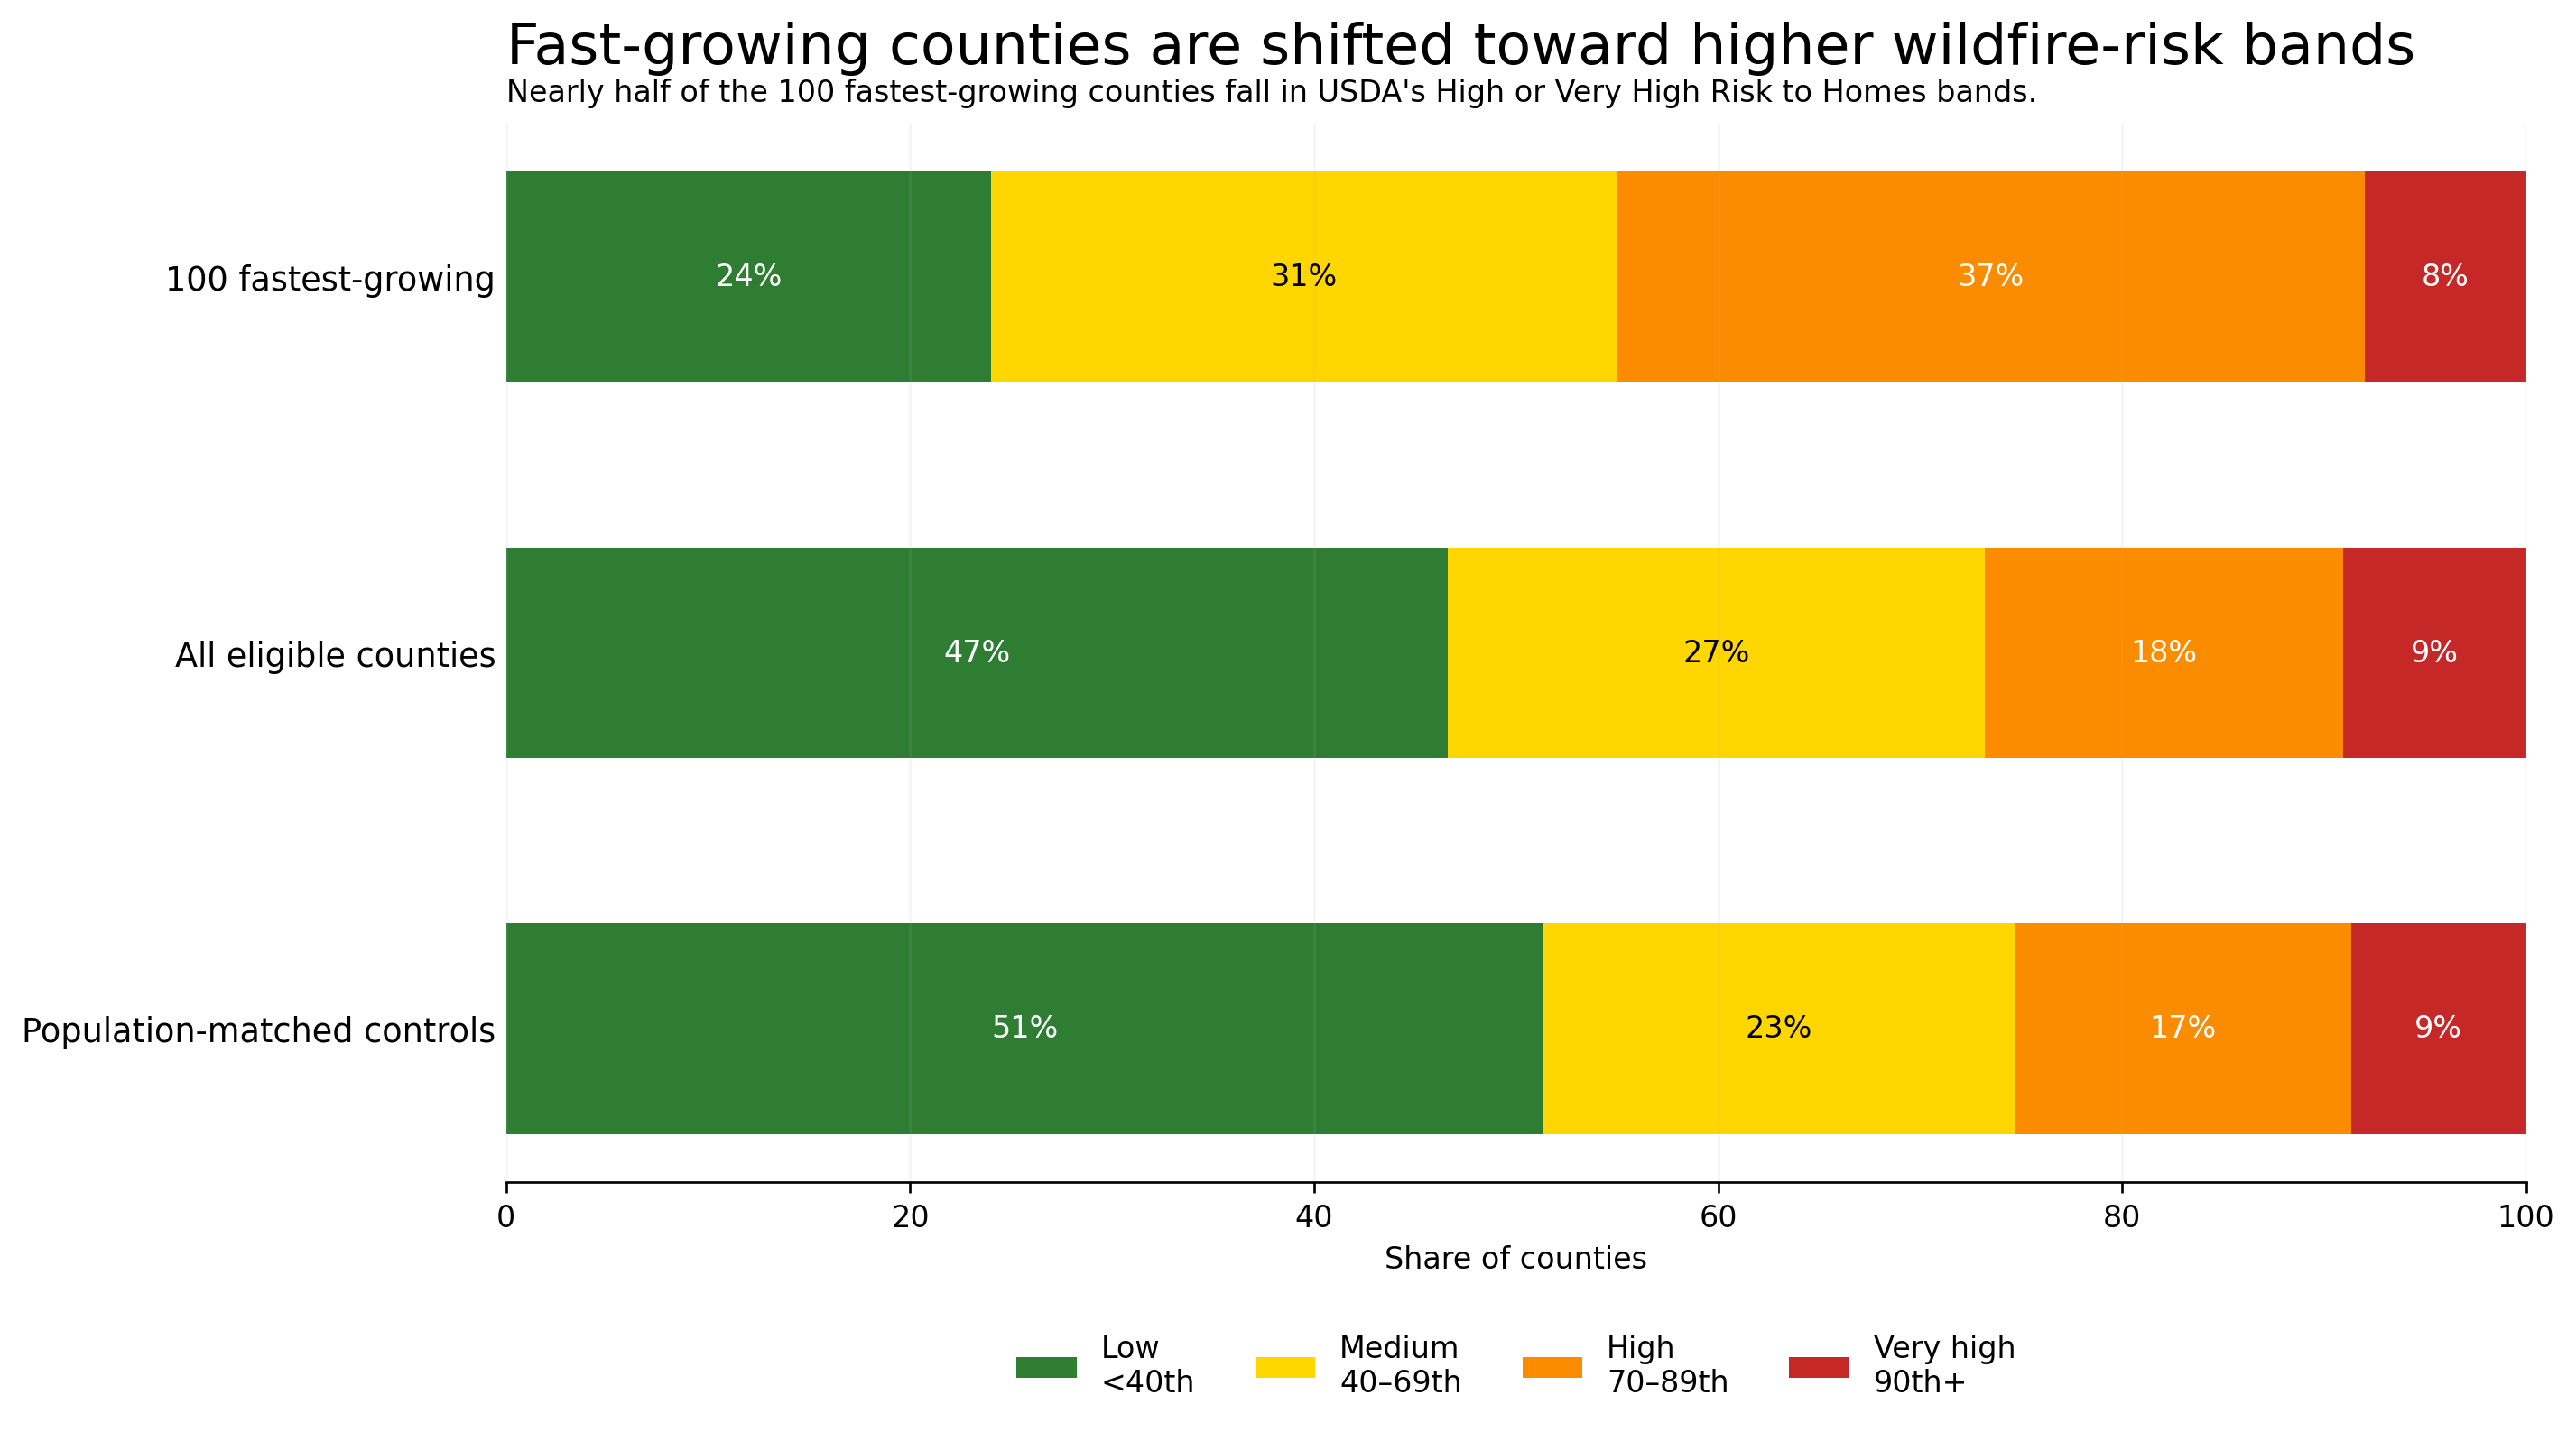
Fast-growing counties are shifted toward higher wildfire-risk bands
USDA classifies the 70th–90th national percentile as High Risk to Homes and the 90th percentile and above as Very High.
What the numbers mean
America’s fastest-growing counties tend to sit in higher wildfire-risk territory than the typical U.S. county.
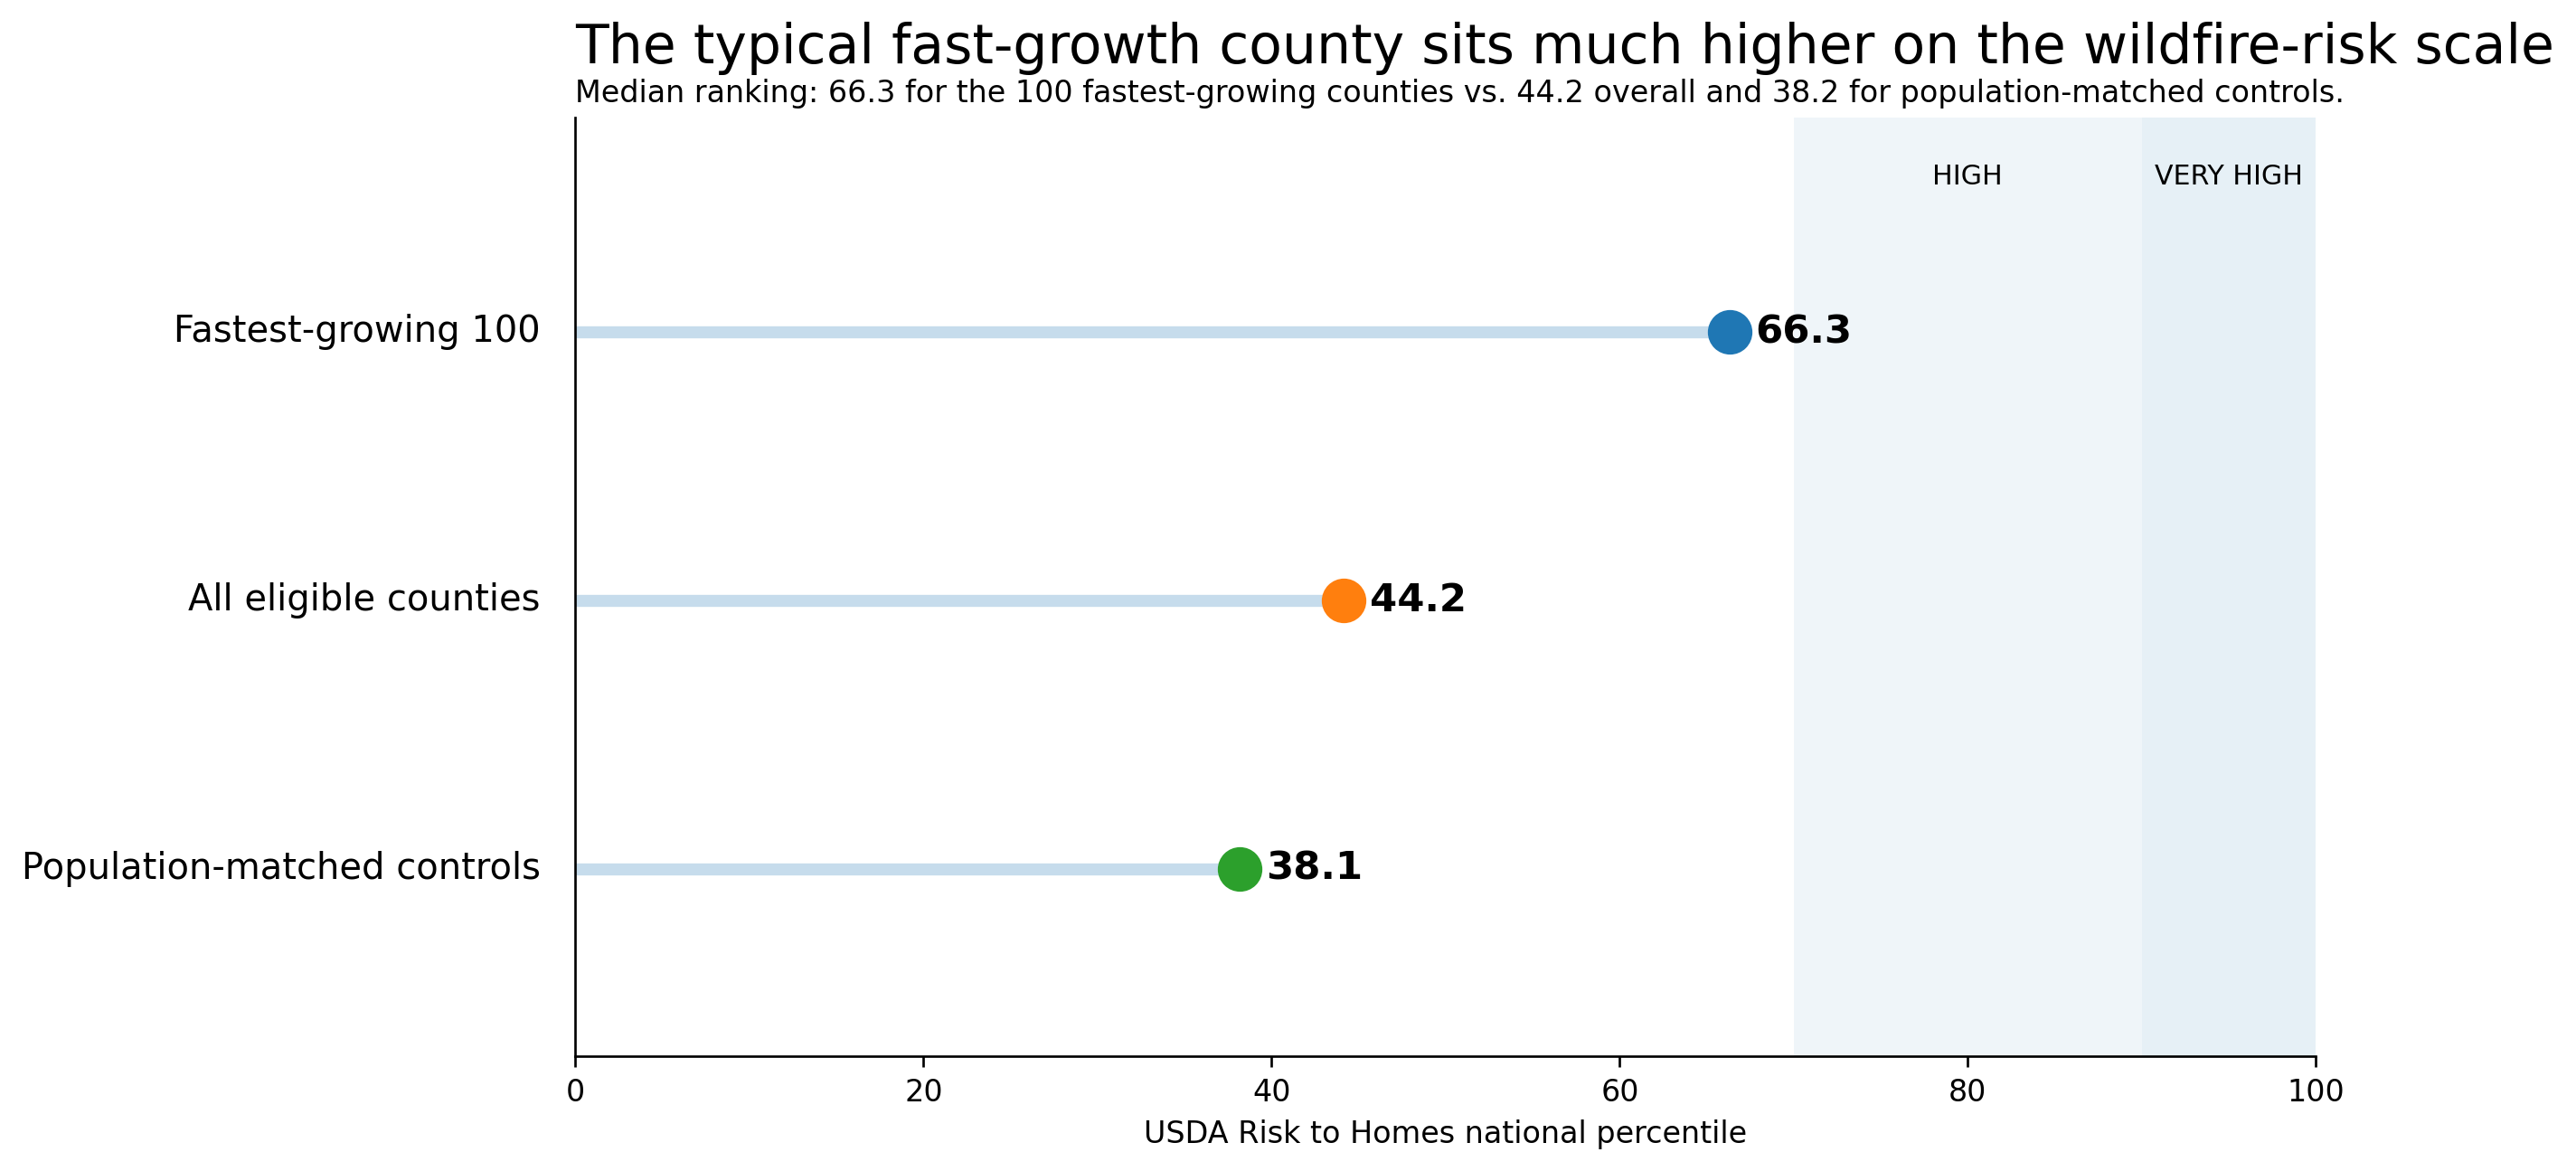
Among counties with at least 20,000 residents, the 100 fastest-growing from 2024 to 2025 had a median USDA Risk to Homes ranking at the 66th national percentile, compared with the 44th percentile across all counties included in the analysis.
Put more simply, the typical county in the fast-growth group ranked higher for wildfire risk to homes than roughly two-thirds of U.S. counties.
This does not mean population growth causes wildfire risk. The analysis identifies places where recent population growth is occurring alongside wildfire conditions that the Forest Service already rates relatively high compared with the rest of the country.
USDA’s Risk to Homes measure combines wildfire likelihood and intensity with the generalized consequences of wildfire to a home. A county at the 90th percentile does not have a 90% chance of experiencing a wildfire or losing homes. It means the county’s relative Risk to Homes measure ranks higher than roughly 90% of counties nationwide.
The difference remains when fast-growing counties are compared with similar-sized counties
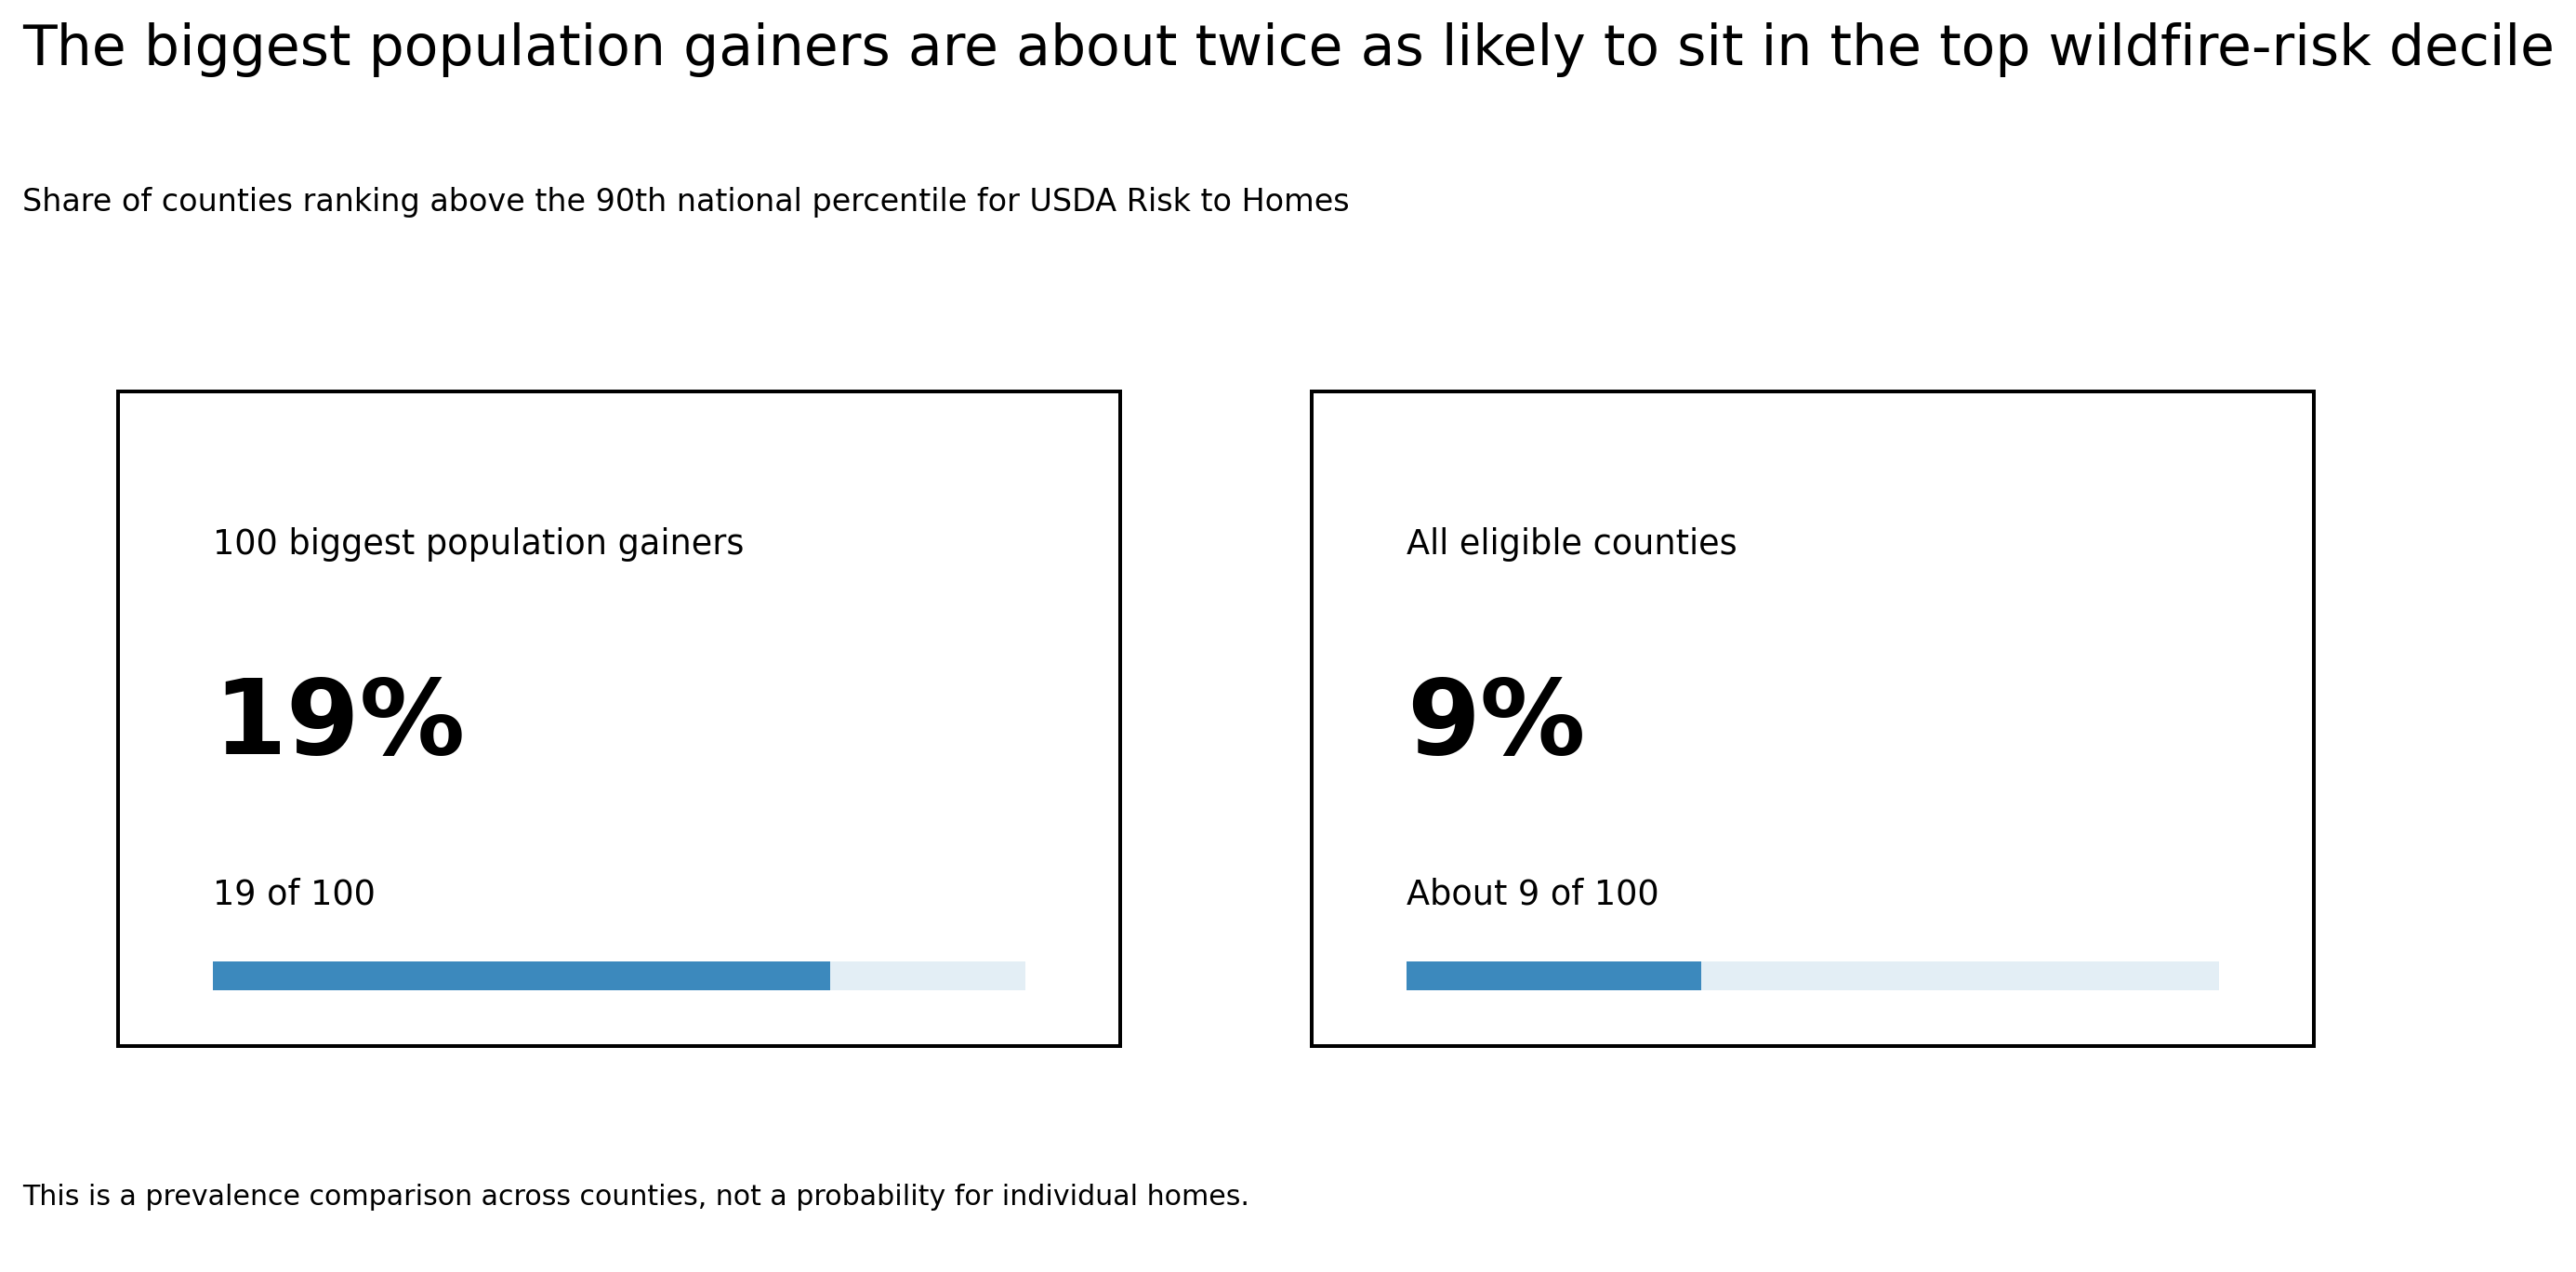
The pattern is even stronger among places adding the most people
Percentage growth can make smaller counties appear unusually prominent, so LandClearly also analyzed absolute population gains.
Among the 100 counties that added the largest number of residents from 2024 to 2025, 19 ranked in the top 10% nationally for USDA Risk to Homes. Across the full comparison group, the equivalent figure was about 9 in 100.
19 of the 100 biggest population gainers rank in the top wildfire-risk decile
Where the overlap is especially visible
Some counties stand out because they combine meaningful recent population growth with particularly high USDA Risk to Homes rankings.
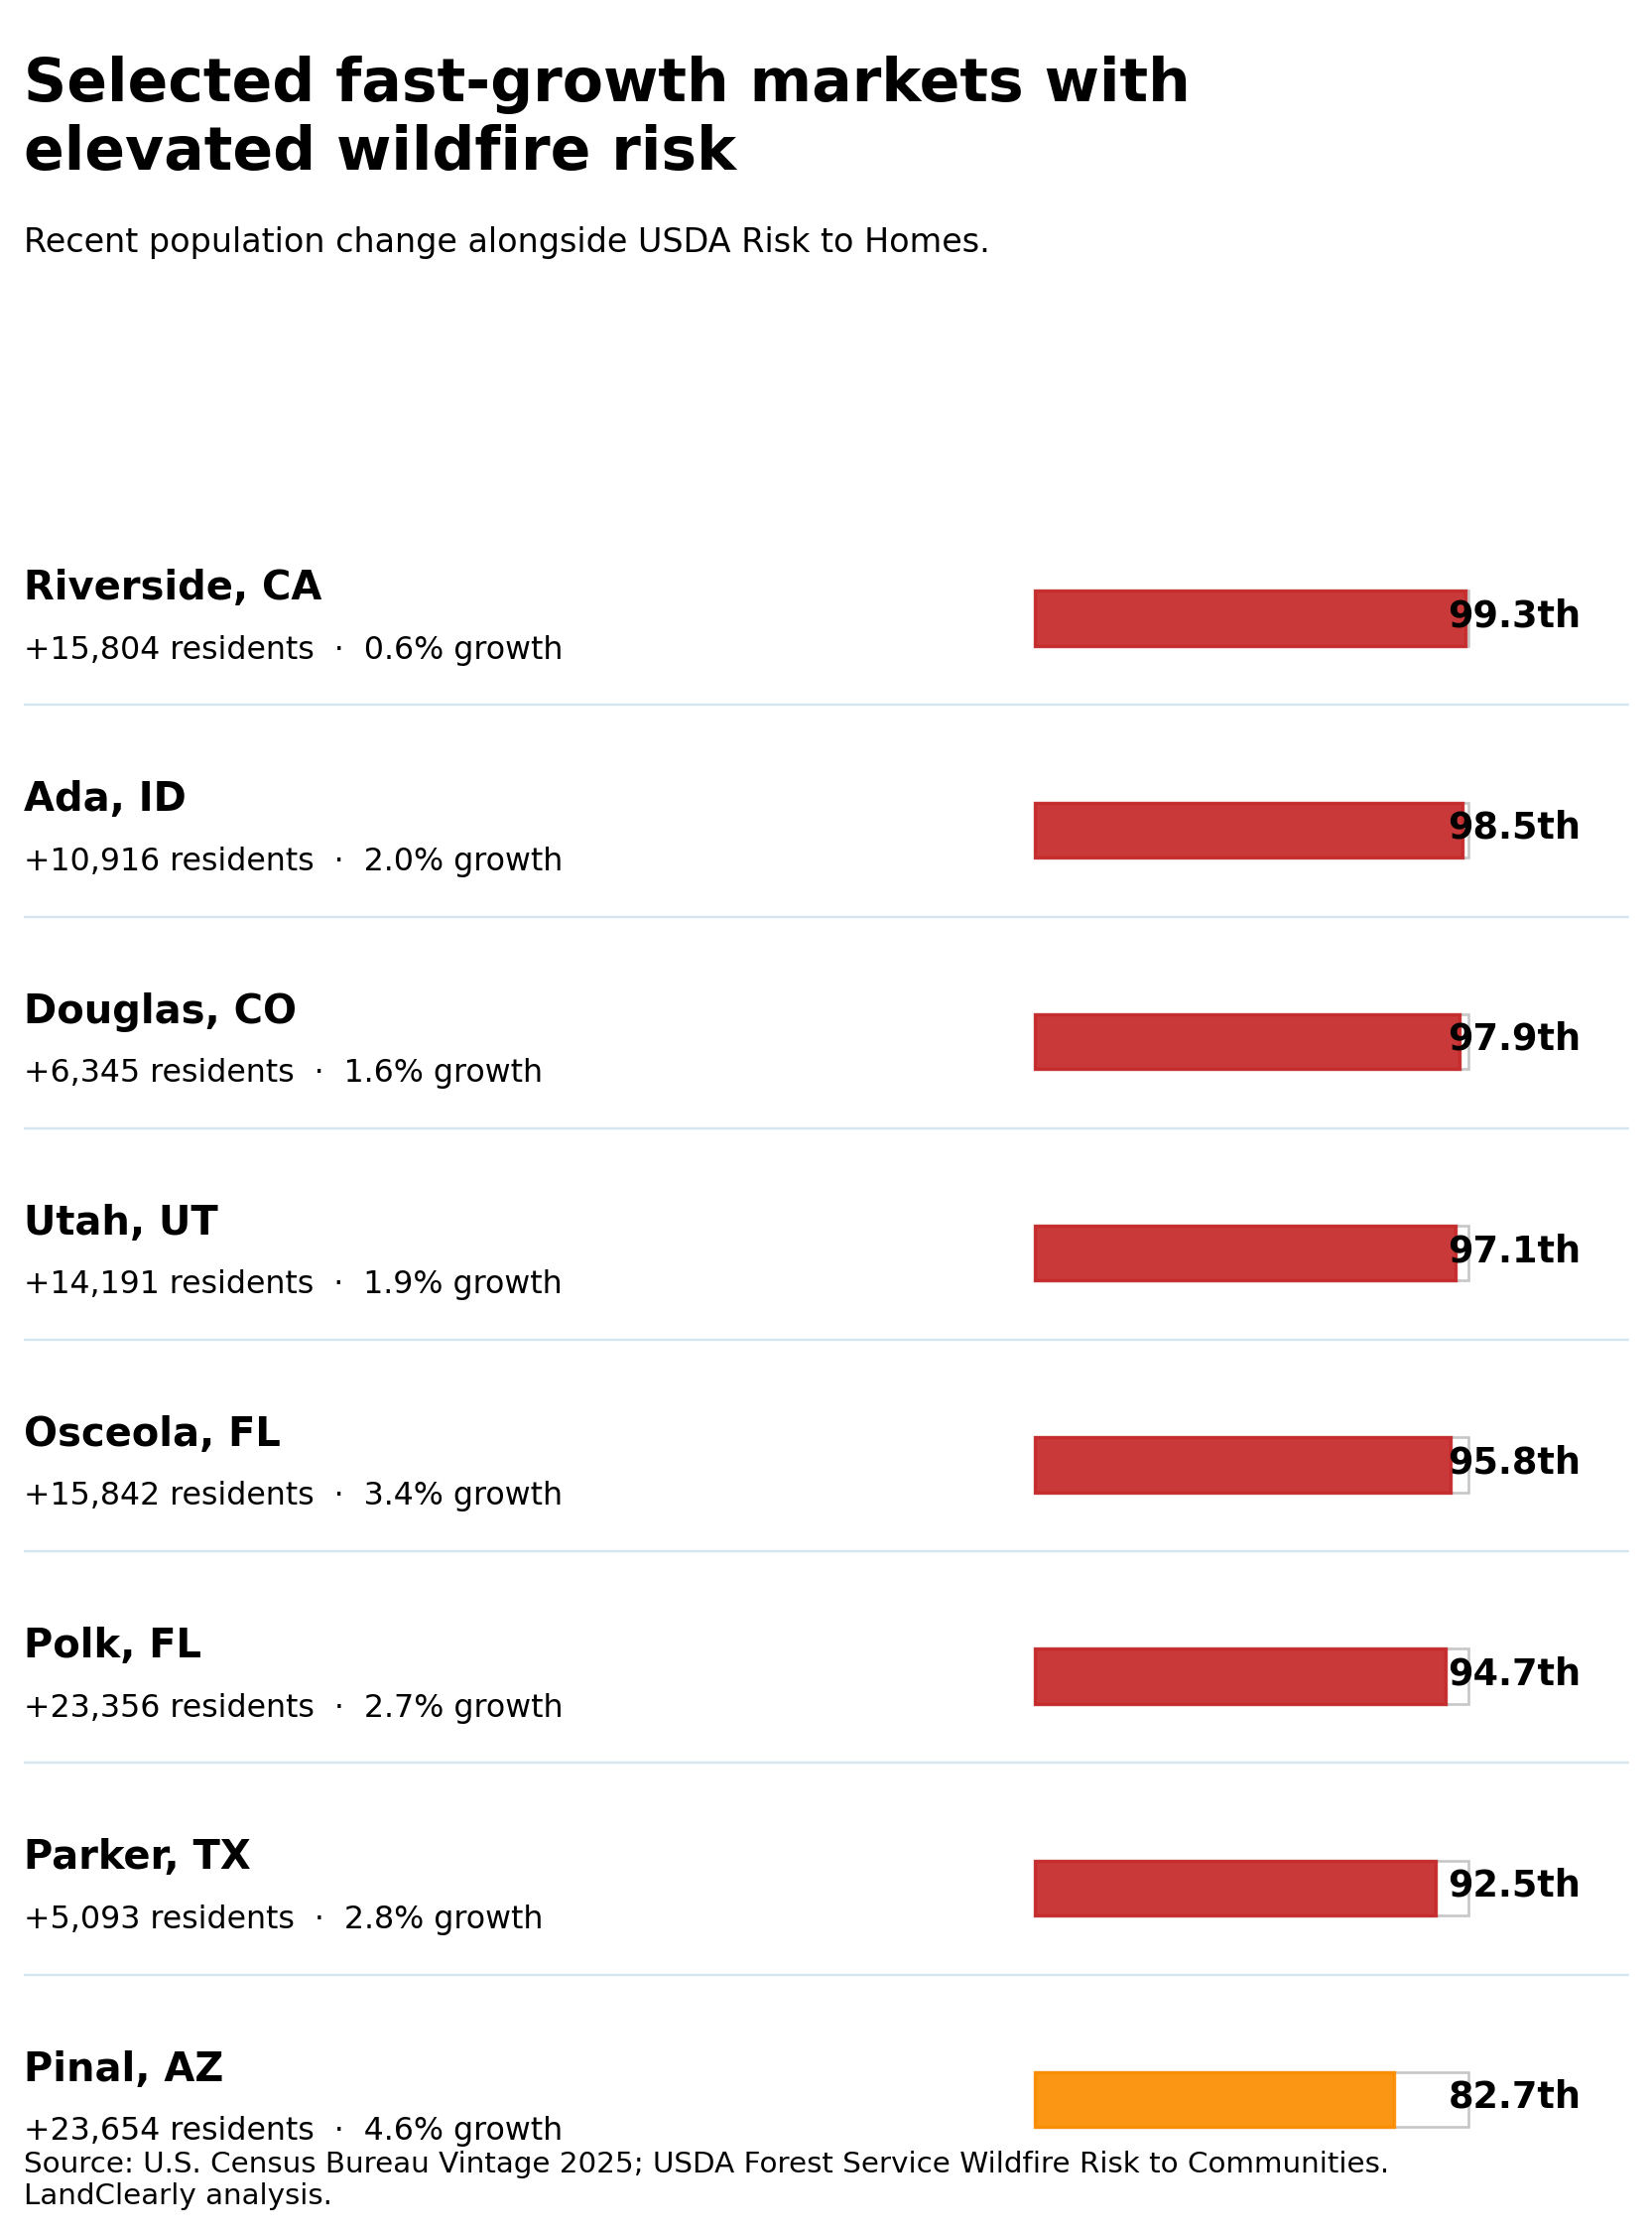
Selected fast-growth markets with elevated wildfire risk
Swipe horizontally to compare the full table.
| Market | Residents added | Growth | Risk to Homes |
|---|---|---|---|
| Pinal County, Arizona | 23,654 | 4.6% | 82.7th percentile |
| Polk County, Florida | 23,356 | 2.7% | 94.7th percentile |
| Osceola County, Florida | 15,842 | 3.4% | 95.8th percentile |
| Riverside County, California | 15,804 | 0.6% | 99.3rd percentile |
| Utah County, Utah | 14,191 | 1.9% | 97.1st percentile |
| Ada County, Idaho | 10,916 | 2.0% | 98.5th percentile |
| Douglas County, Colorado | 6,345 | 1.6% | 97.9th percentile |
| Parker County, Texas | 5,093 | 2.8% | 92.5th percentile |
Pinal County, Arizona
Pinal County added 23,654 residents in one year, growing from 515,726 residents in 2024 to 539,380 in 2025. Its USDA Risk to Homes ranking is approximately the 83rd national percentile.
Pinal stands out because it ranks highly both for percentage population growth and for absolute population gain.
Texas stands out in the national growth data
Texas has 26 counties among the 100 fastest-growing U.S. counties in the analysis.
All 26 rank above the national midpoint on USDA’s Risk to Homes measure. Their median Risk to Homes ranking is approximately the 68th national percentile, and 11 of the 26 rank in the top 30% nationally.
- Liberty County — 72.3rd percentile
- Comal County — 73.9th
- Hays County — 73.5th
- Denton County — 72.5th
- Wise County — 87.4th
- Johnson County — 89.2nd
- Chambers County — 91.0th
- Parker County — 92.5th
Where wildfire risk is also appearing in insurance decisions
Texas offers an early look at how wildfire exposure can appear in actual home-insurance underwriting decisions.
In September 2026, the Texas Department of Insurance launched ZIP-level data showing why residential policies are declined, canceled or not renewed. One of the official reportable reasons is Exposure to loss — Wildfire.
Across Texas, wildfire accounted for 23,441 of 246,990 recorded reason-instances associated with residential declinations, or approximately 9.5%.
Several Parker-area ZIP codes show a much stronger wildfire signal than Texas overall
Important: This does not mean 62.3% of insurance applications were declined because of wildfire. Texas insurers may report multiple reasons for the same insurance action. The figures measure the share of recorded reason-instances coded for wildfire.
Parker County added 5,093 residents from 2024 to 2025 and ranks at the 92.5th national percentile for USDA Risk to Homes. That combination makes Parker County a useful case study of how rapid population growth, elevated wildfire exposure and insurance underwriting can intersect in one market. The analysis does not claim that the three factors cause one another.

Florida shows an even stronger regional concentration
Florida has 15 counties among the nation’s 100 fastest-growing by percentage. Fourteen of those 15 rank in the top 30% nationally for USDA Risk to Homes.
Several rank in the top 10% nationally, including Osceola County at the 95.8th percentile, Charlotte County at the 95.6th percentile and Polk County at the 94.7th percentile.
This demonstrates that the growth-and-wildfire overlap is not limited to the Western United States.
Explore the data
Download the national county analysis (CSV) (opens in a new tab) with the 1,822-county comparison dataset used in this report.
Download the Parker-area insurance analysis (CSV) (opens in a new tab) with the ZIP-level TDI reason-instance calculations used in the Texas case study.
The downloads are provided without an email gate so the calculations can be inspected and reused with attribution.
Methodology
LandClearly combined U.S. Census Bureau Vintage 2025 county population estimates with USDA Forest Service Wildfire Risk to Communities county summaries.
The primary comparison includes counties with at least 20,000 residents in both 2024 and 2025, producing a final universe of 1,822 counties.
Percentage population growth was calculated as (2025 population – 2024 population) ÷ 2024 population × 100. Absolute growth was calculated as 2025 population – 2024 population.
The primary wildfire measure was USDA’s national Risk to Homes percentile. Wildfire Likelihood was retained as a secondary measure. LandClearly did not create a proprietary wildfire-risk score.
The analysis examined the top 50 counties by percentage growth, the top 100 counties by percentage growth and the top 100 counties by absolute population gain.
Robustness tests repeated the analysis using minimum county populations of 20,000, 50,000 and 100,000. The overall pattern remained.
The 100 fastest-growing counties were also compared with 300 counties with closely similar 2024 population levels. The fast-growth cohort had a median Risk to Homes ranking of 66.3. The matched comparison group had a median ranking of 38.2.
Important limitations
- The analysis measures overlap, not causation.
- Population growth does not create the wildfire-risk values.
- USDA Risk to Homes is a modeled, relative national measure and is not an individual-home wildfire probability.
- County averages can hide significant local differences.
- New population growth may occur in lower-risk or higher-risk sections within the same county.
- Census population data reflects 2024–2025 growth.
- USDA wildfire models reflect earlier hazard and landscape inputs, not live 2026 fire conditions.
- Texas insurers may report multiple reasons for the same insurance action.
- TDI reason counts therefore cannot be interpreted as unique declined applications.
- ZIP codes can cross county boundaries.
Primary sources
U.S. Census Bureau — County Population Totals and Components of Change: 2020–2025 (opens in a new tab)
USDA Forest Service — Wildfire Risk to Communities — Download Data (opens in a new tab)
USDA Forest Service — Wildfire Risk to Communities — Methods (opens in a new tab)
Texas Department of Insurance — Reasons home and auto insurance policies are declined, not renewed, or canceled (opens in a new tab)
Texas Department of Insurance — TDI launches new transparency tool showing why some home policies are declined, canceled, or not renewed (opens in a new tab)
About this analysis
LandClearly conducted this analysis to examine where recent U.S. population growth and existing wildfire risk are occurring in the same housing markets.
The underlying population, wildfire and Texas insurance data come from public government sources. The cross-dataset comparisons, calculations and derived findings are LandClearly analysis.
Related LandClearly resources
LandClearly helps property owners plan land-clearing and vegetation-management projects. For practical planning guidance, see our How to Clear Land guide and our Forestry Mulching guide.